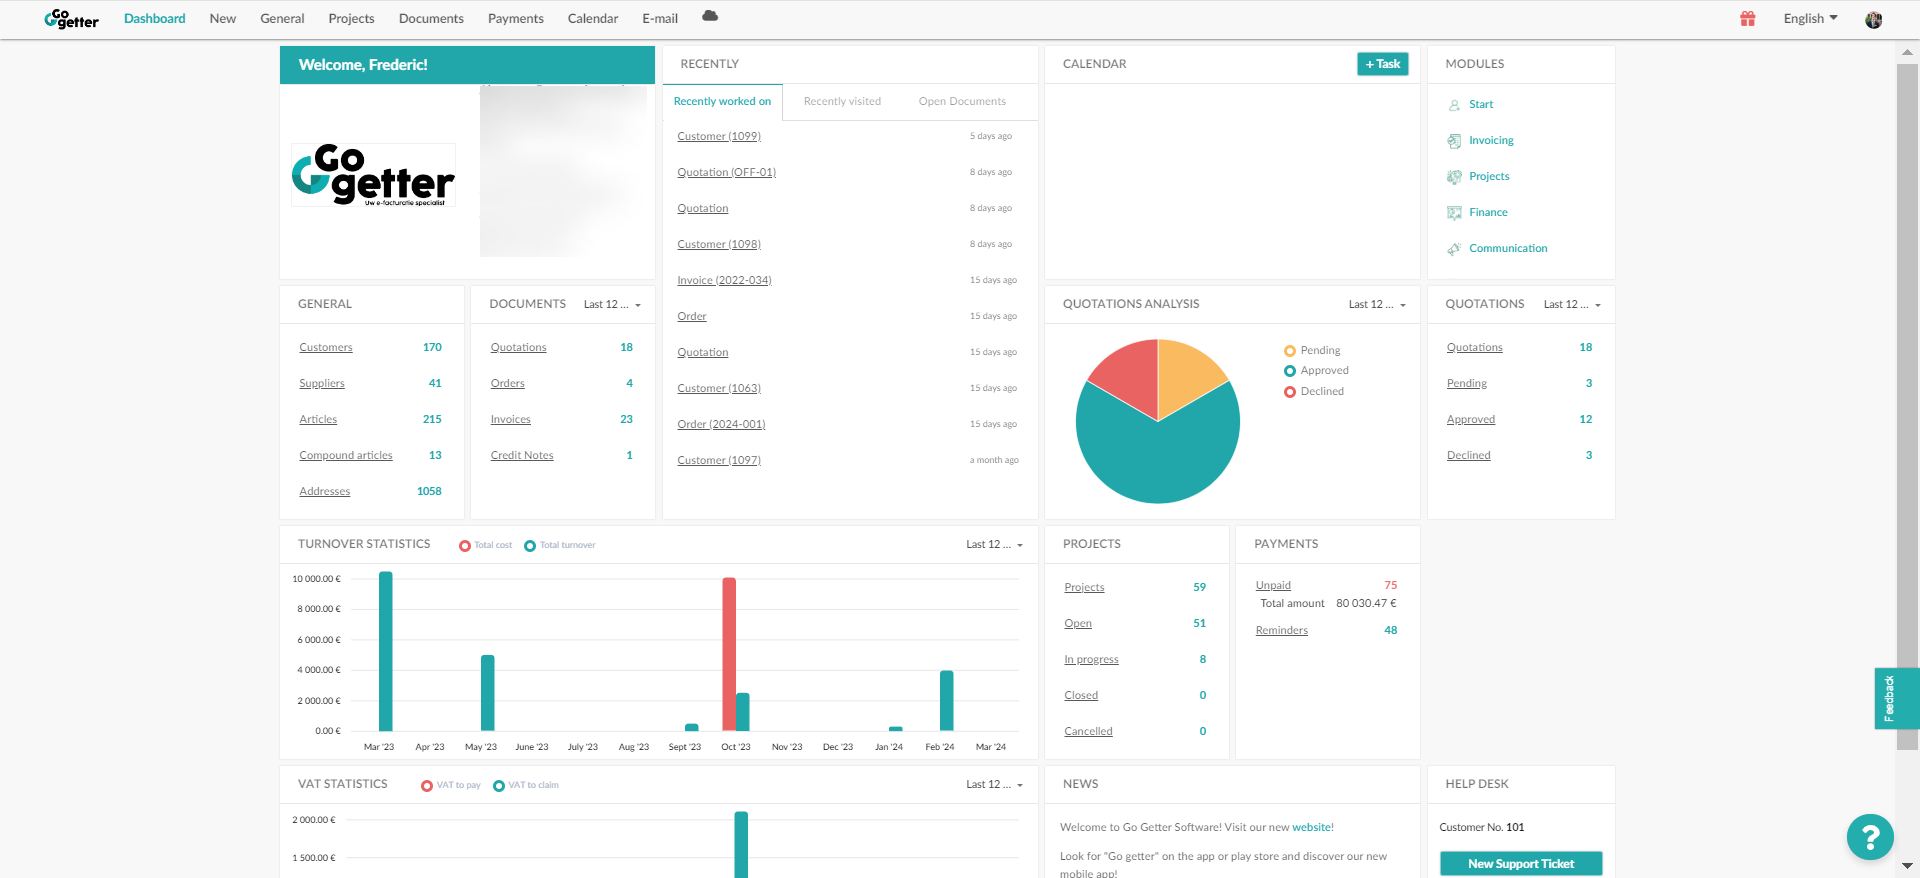
Welcome to your dashboard! Here you'll find all your company information at a glance. It's your company's "beating heart".
General
This section gives an overview of the number of customers, suppliers, items, etc. present in your platform.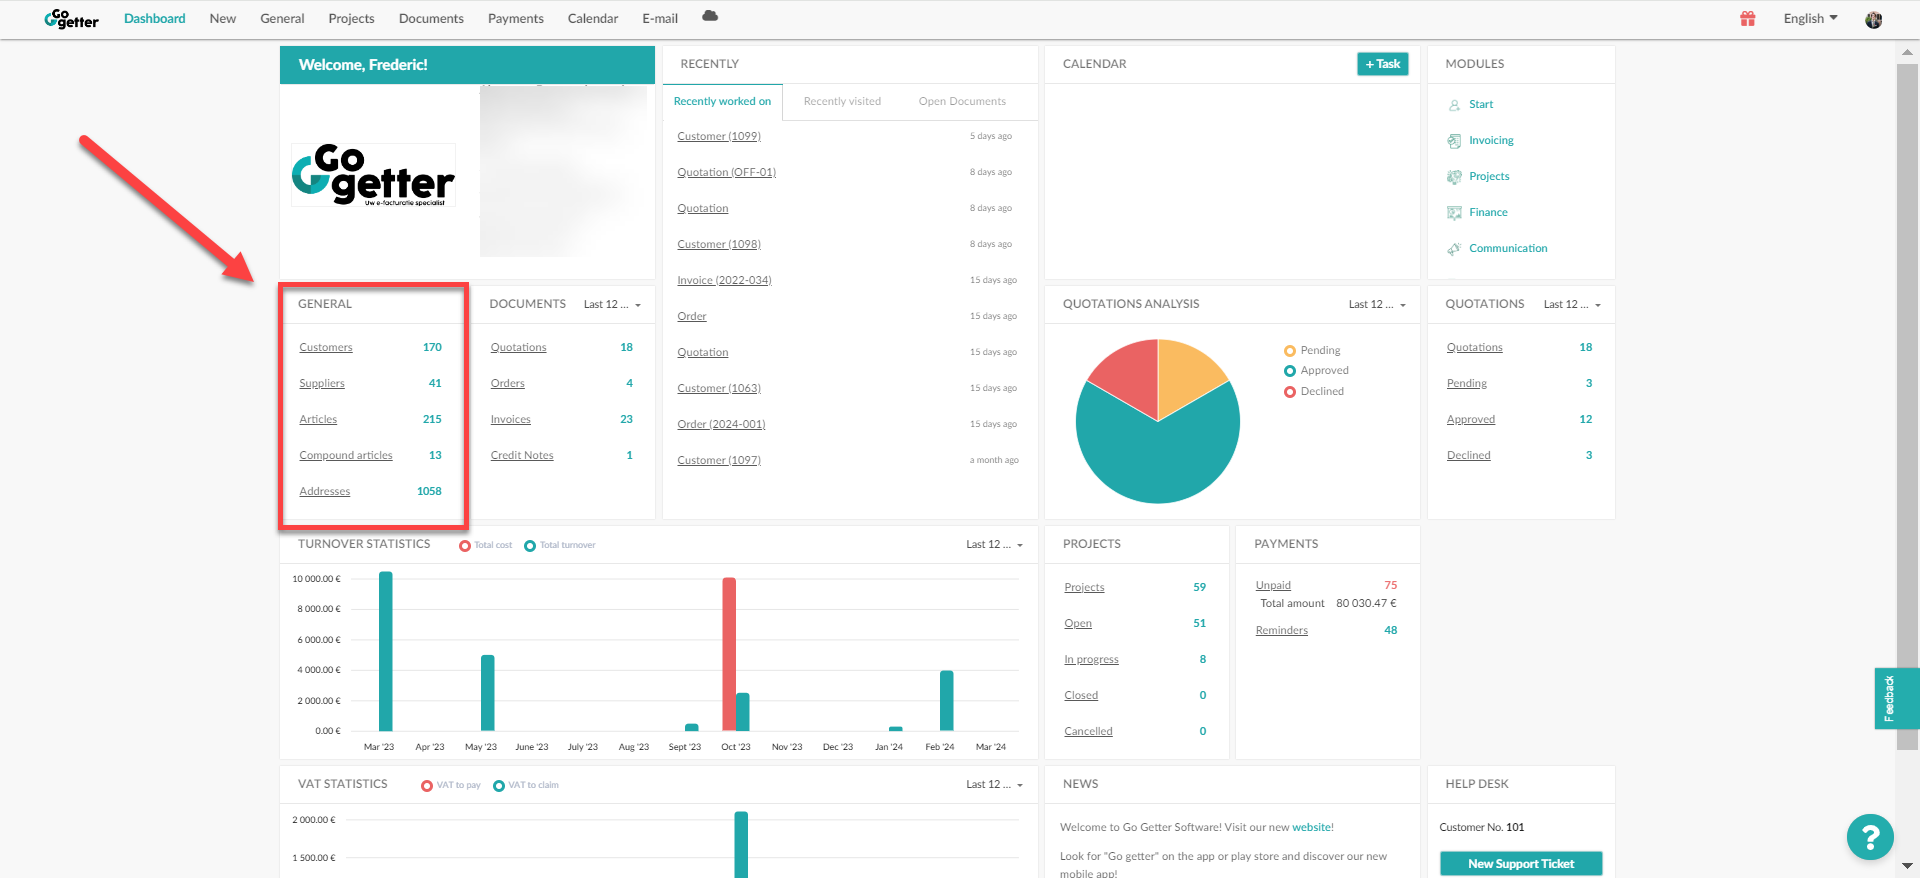
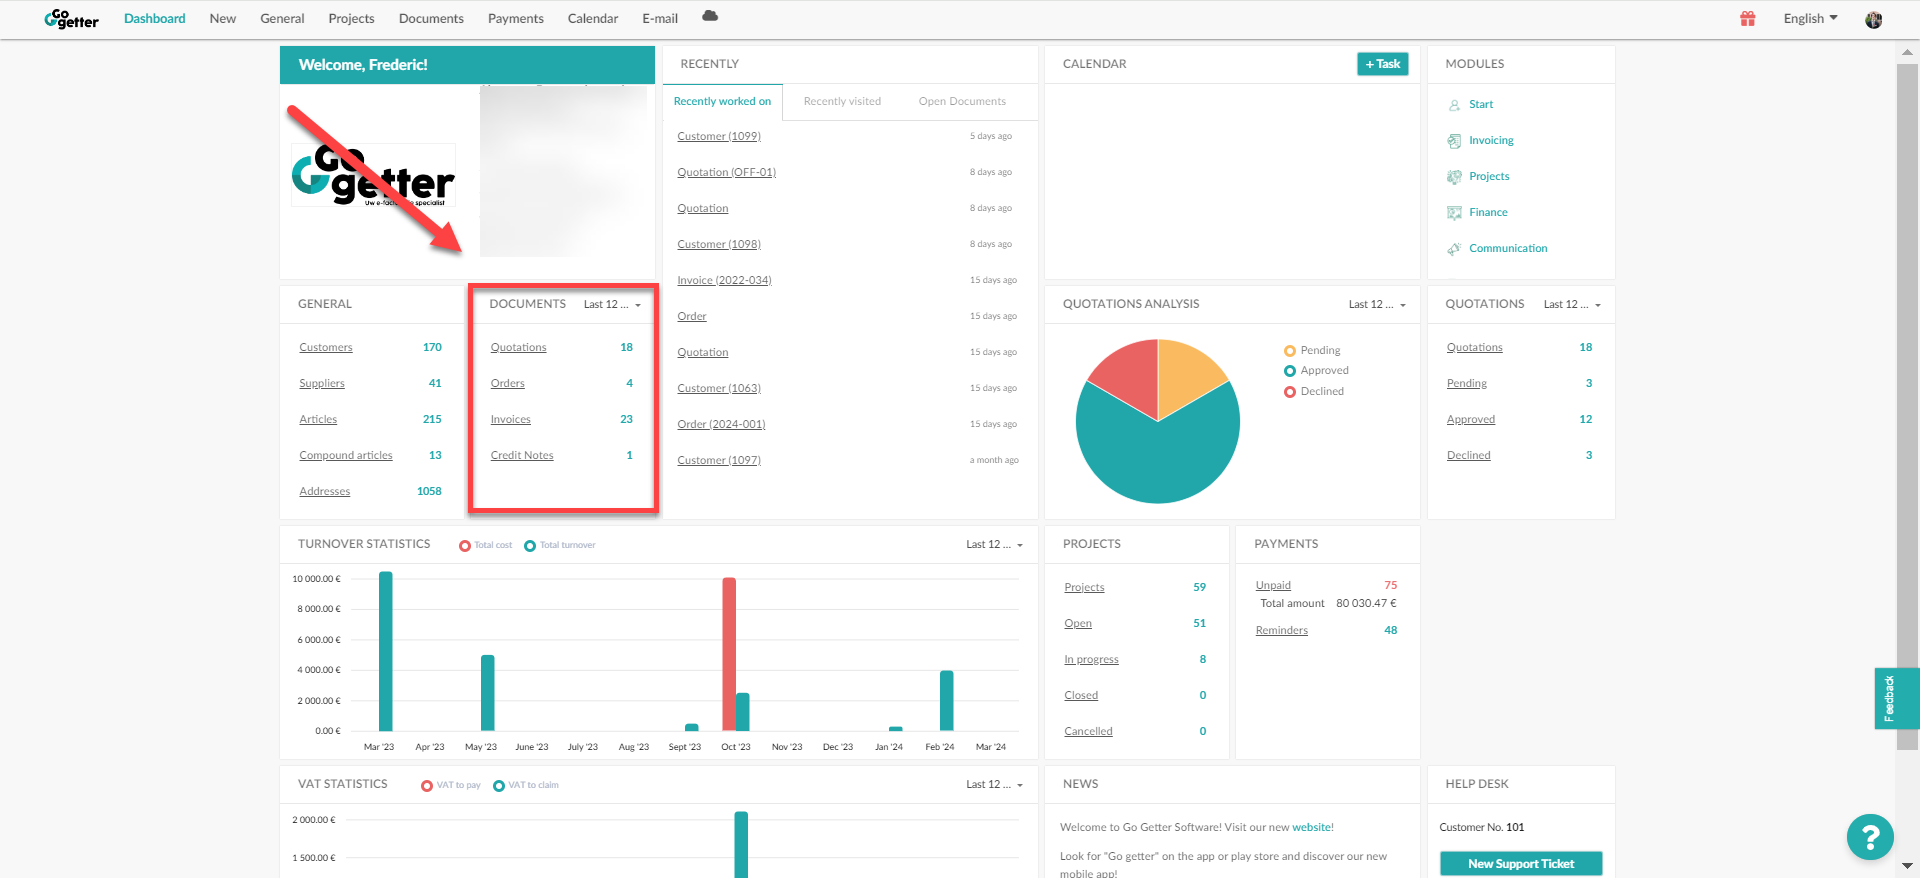
Documents
Here you'll find an overview of the number of documents you've already created in your platform.
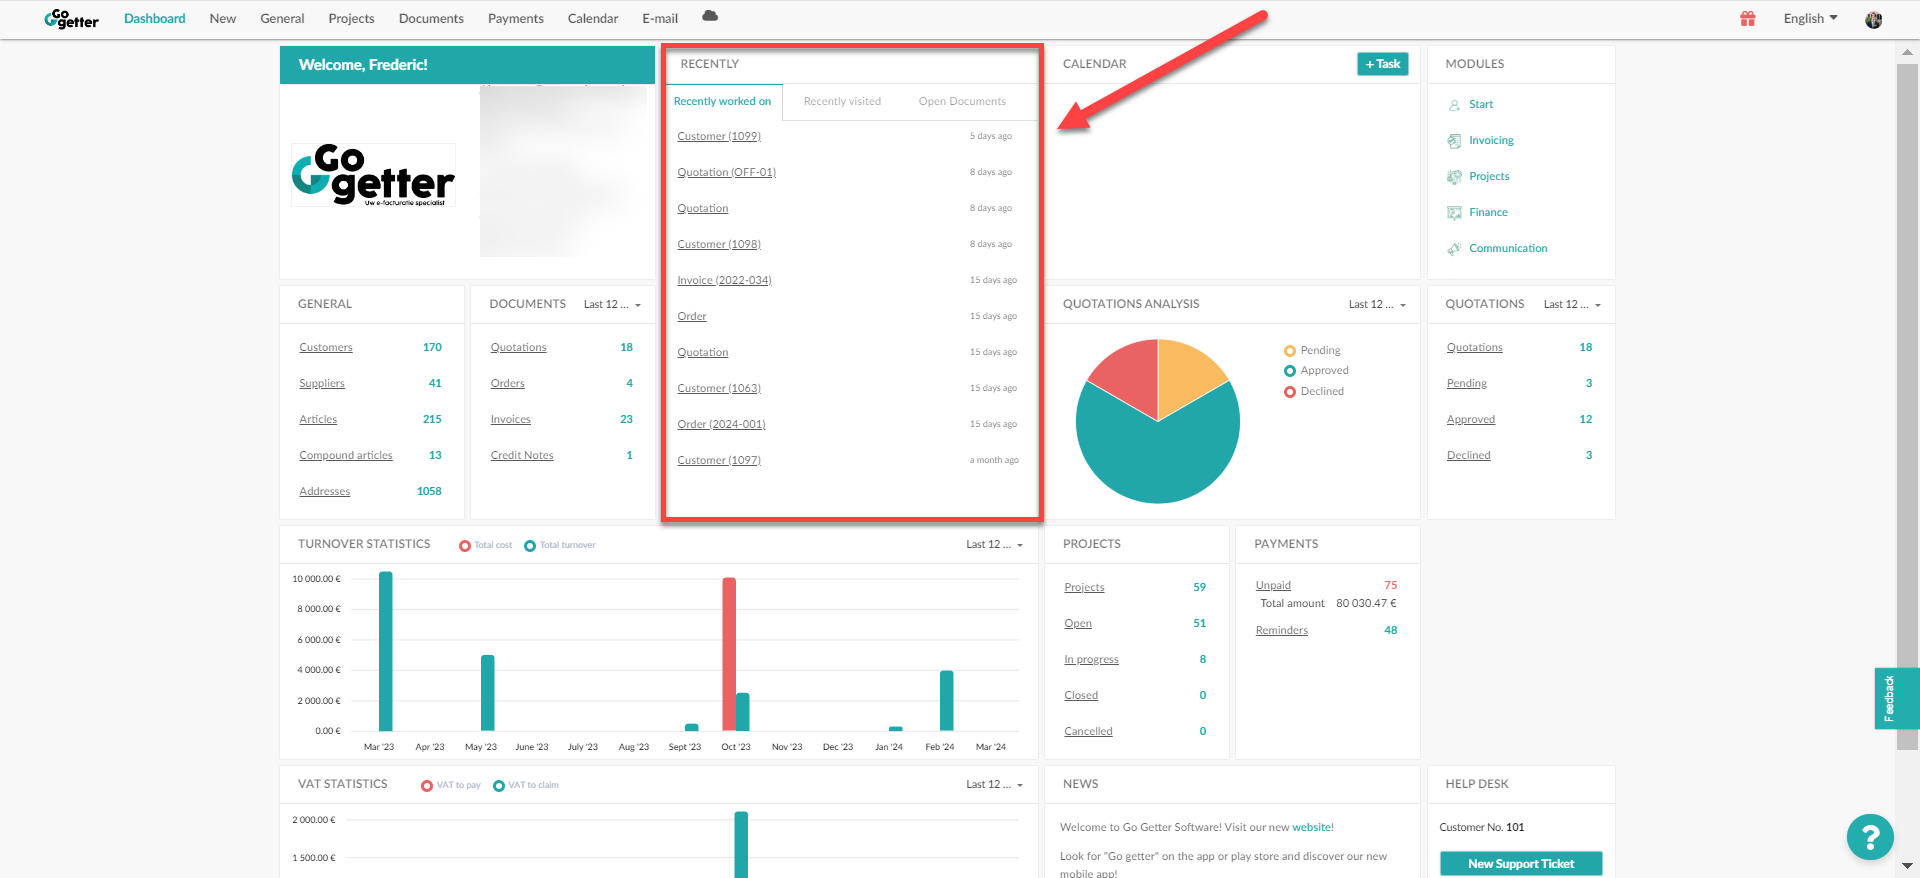
Recently
Recent activity within your platform is displayed here, with a breakdown of recently visited pages and opened documents.
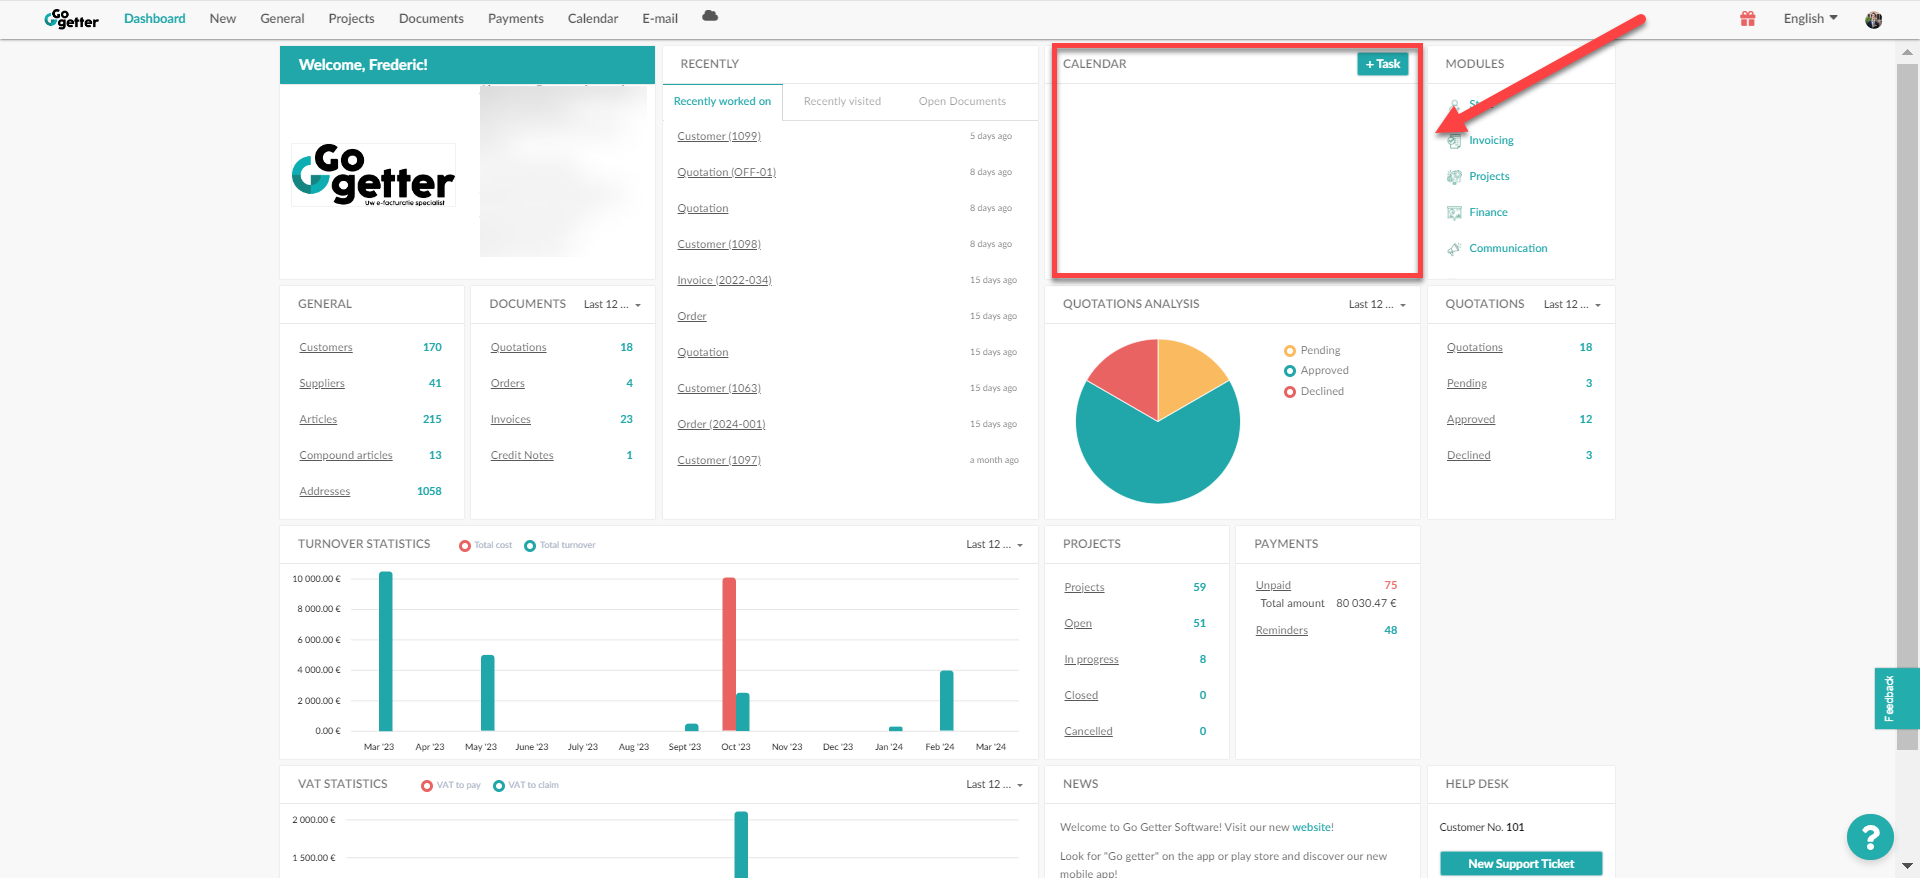
Calender
Here you'll find a quick overview of the appointments in your calendar. You can also immediately schedule a new appointment via this section by clicking on the "+Ticket" button.
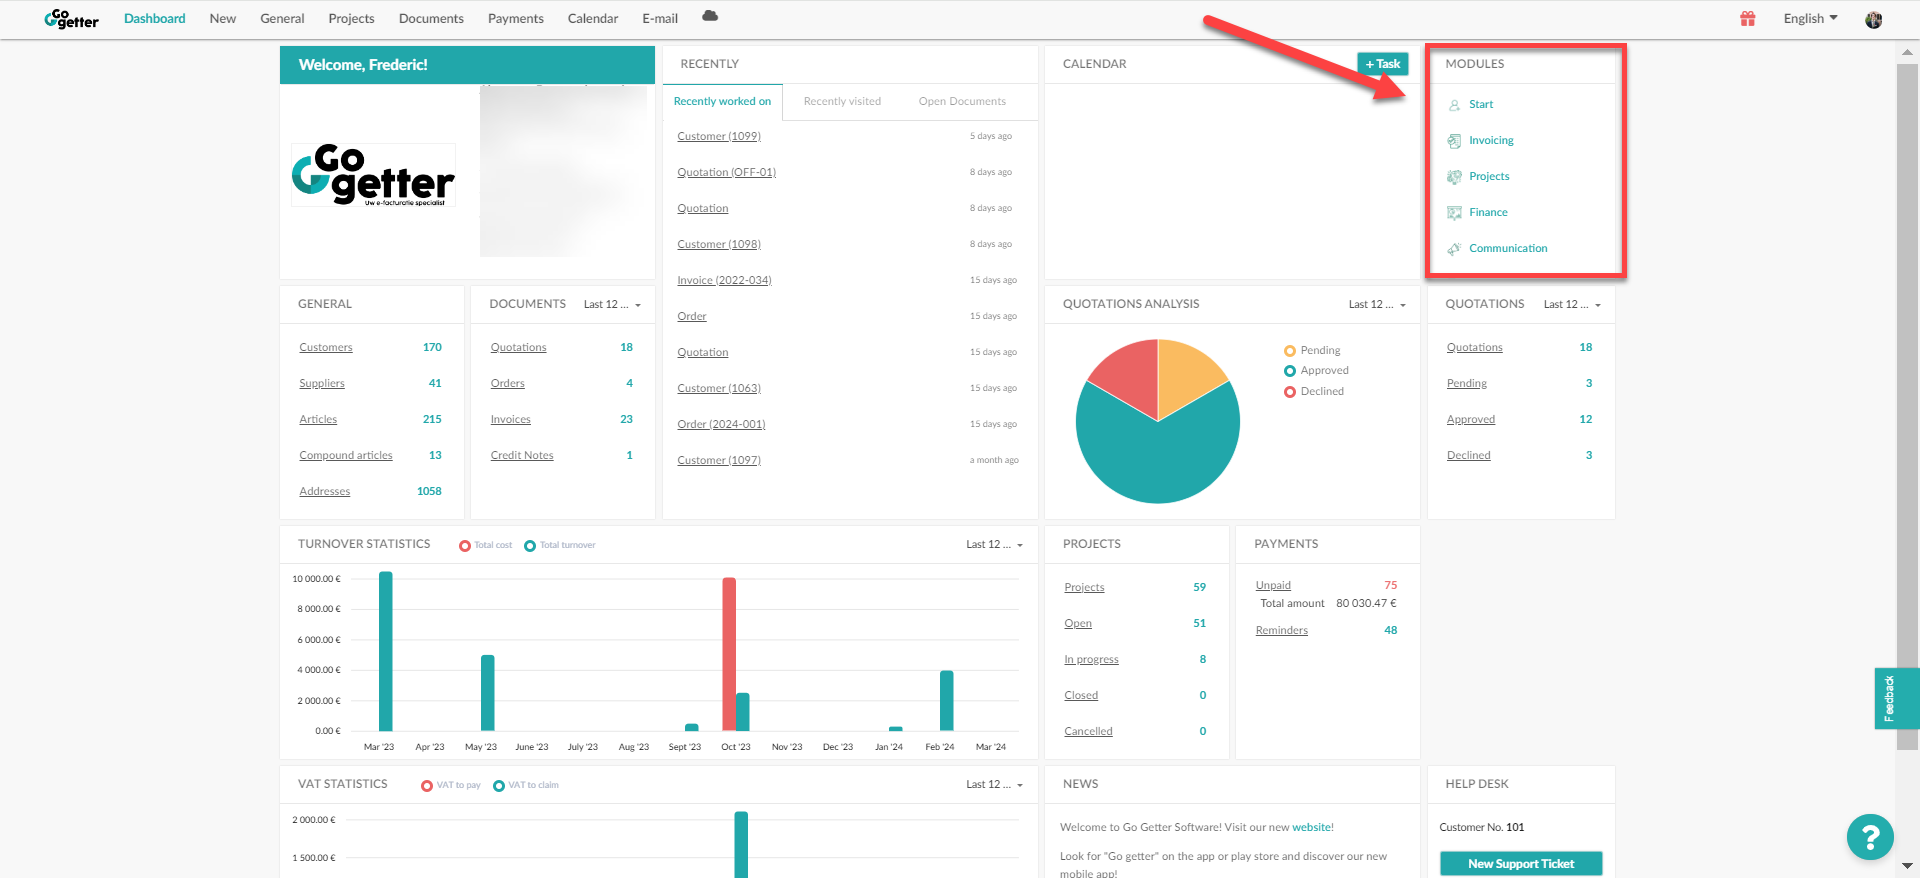
Modules
An overview of the modules you have selected. Would you like to activate an additional module? Contact us at support@gogettersoftware.com.
Analyse devis
This is a visual representation in the form of a pie chart of your quotations. Three different statuses are recorded for quotations: "Pending", "Approved" and "Rejected".
Only registered documents are included in these statistics!
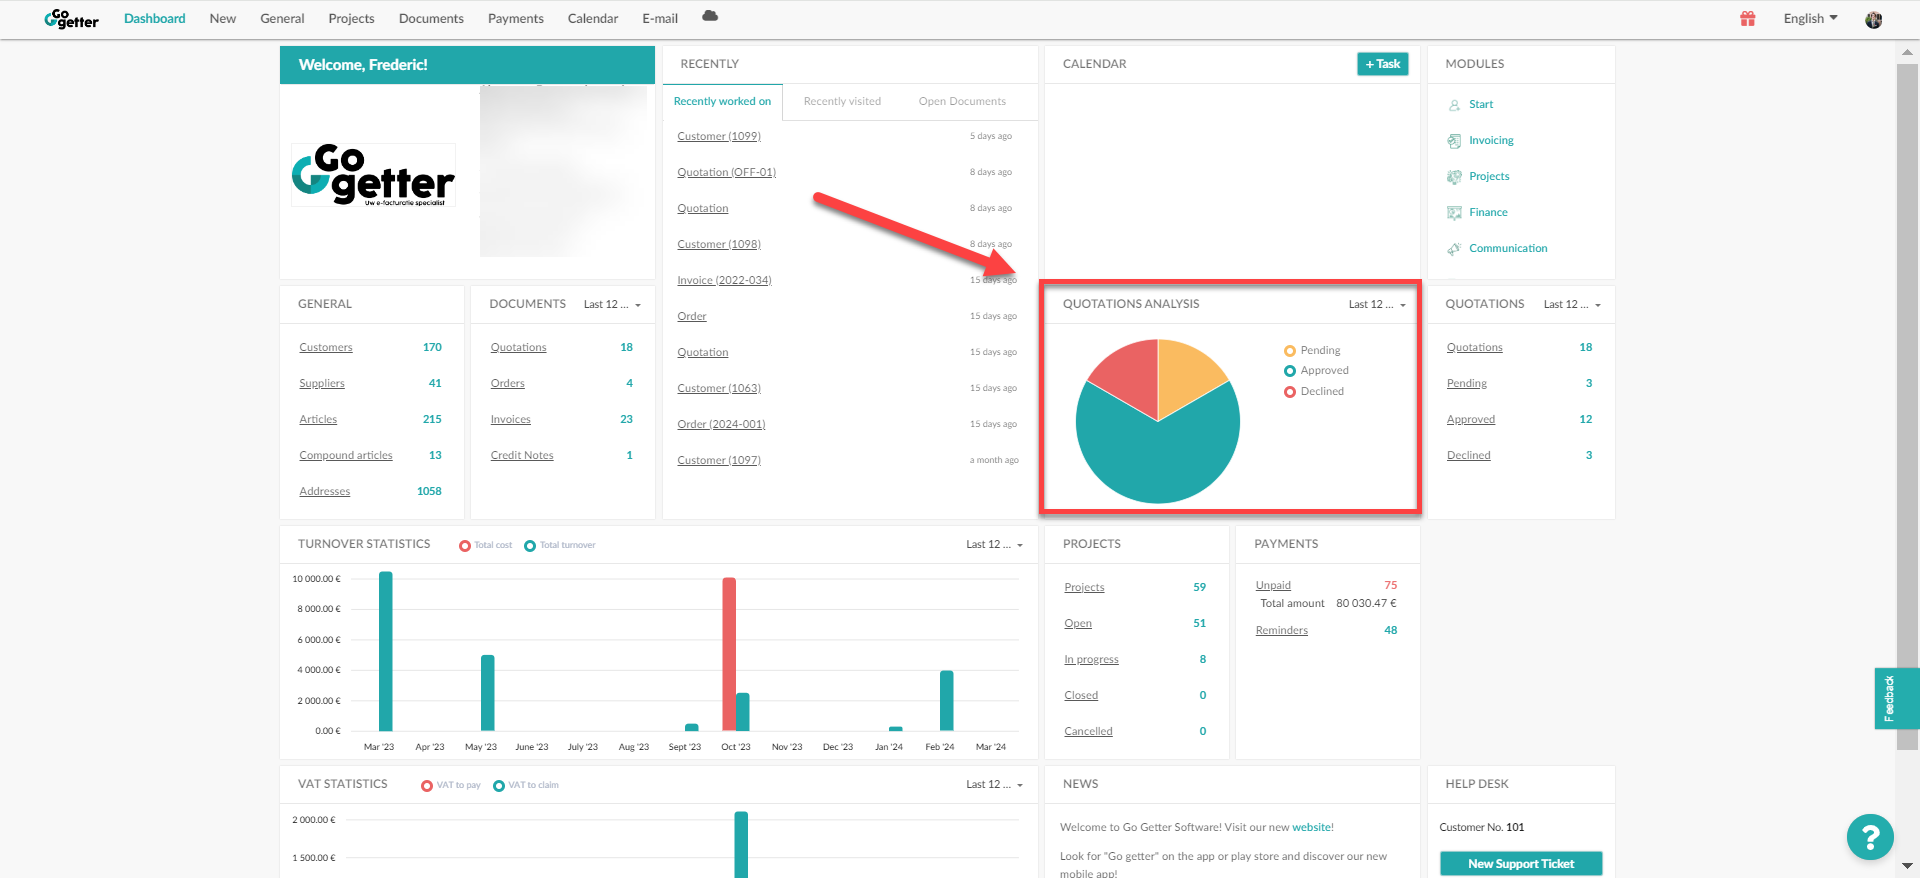
At the top right of the statistics, you can adjust the time horizon. You can opt for the last 12 months or the financial year.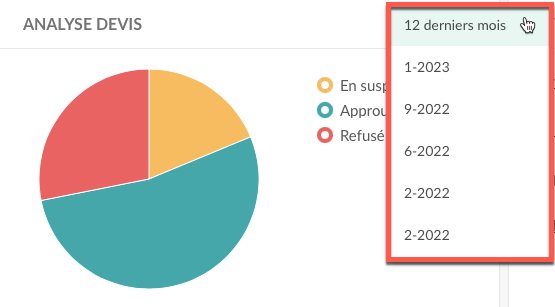
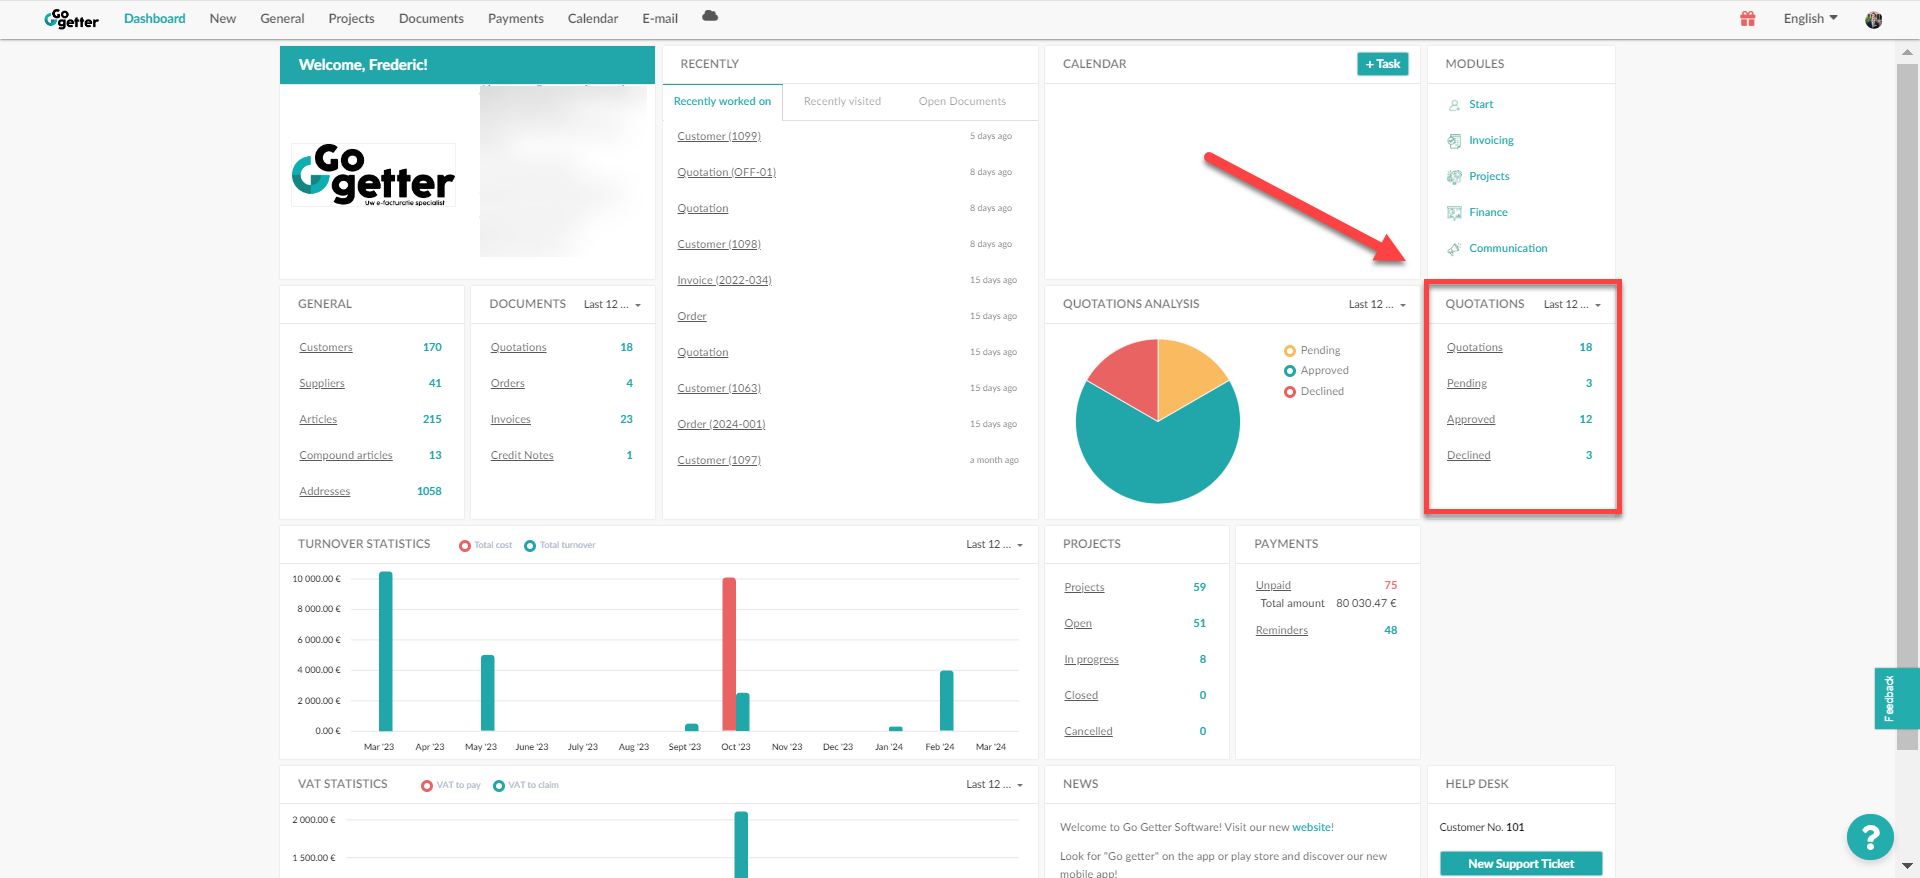
Quotes
Here you'll find a breakdown of quotations according to their status: "Pending", "Approved" and "Rejected". When you click on one of these statuses, you are taken to a list of all quotations. At the top of the list, you'll find the total number of quotations saved.
Statistics C/A
A clear bar chart showing sales figures for previous periods. Total sales and total costs are displayed.
This is the invoiced sales per month (revenue), excluding VAT. Sales are calculated as the difference between invoices and credit notes.
The total cost in this table reflects the cost per month based on expenses. These are calculated as the difference between invoices and credit notes.
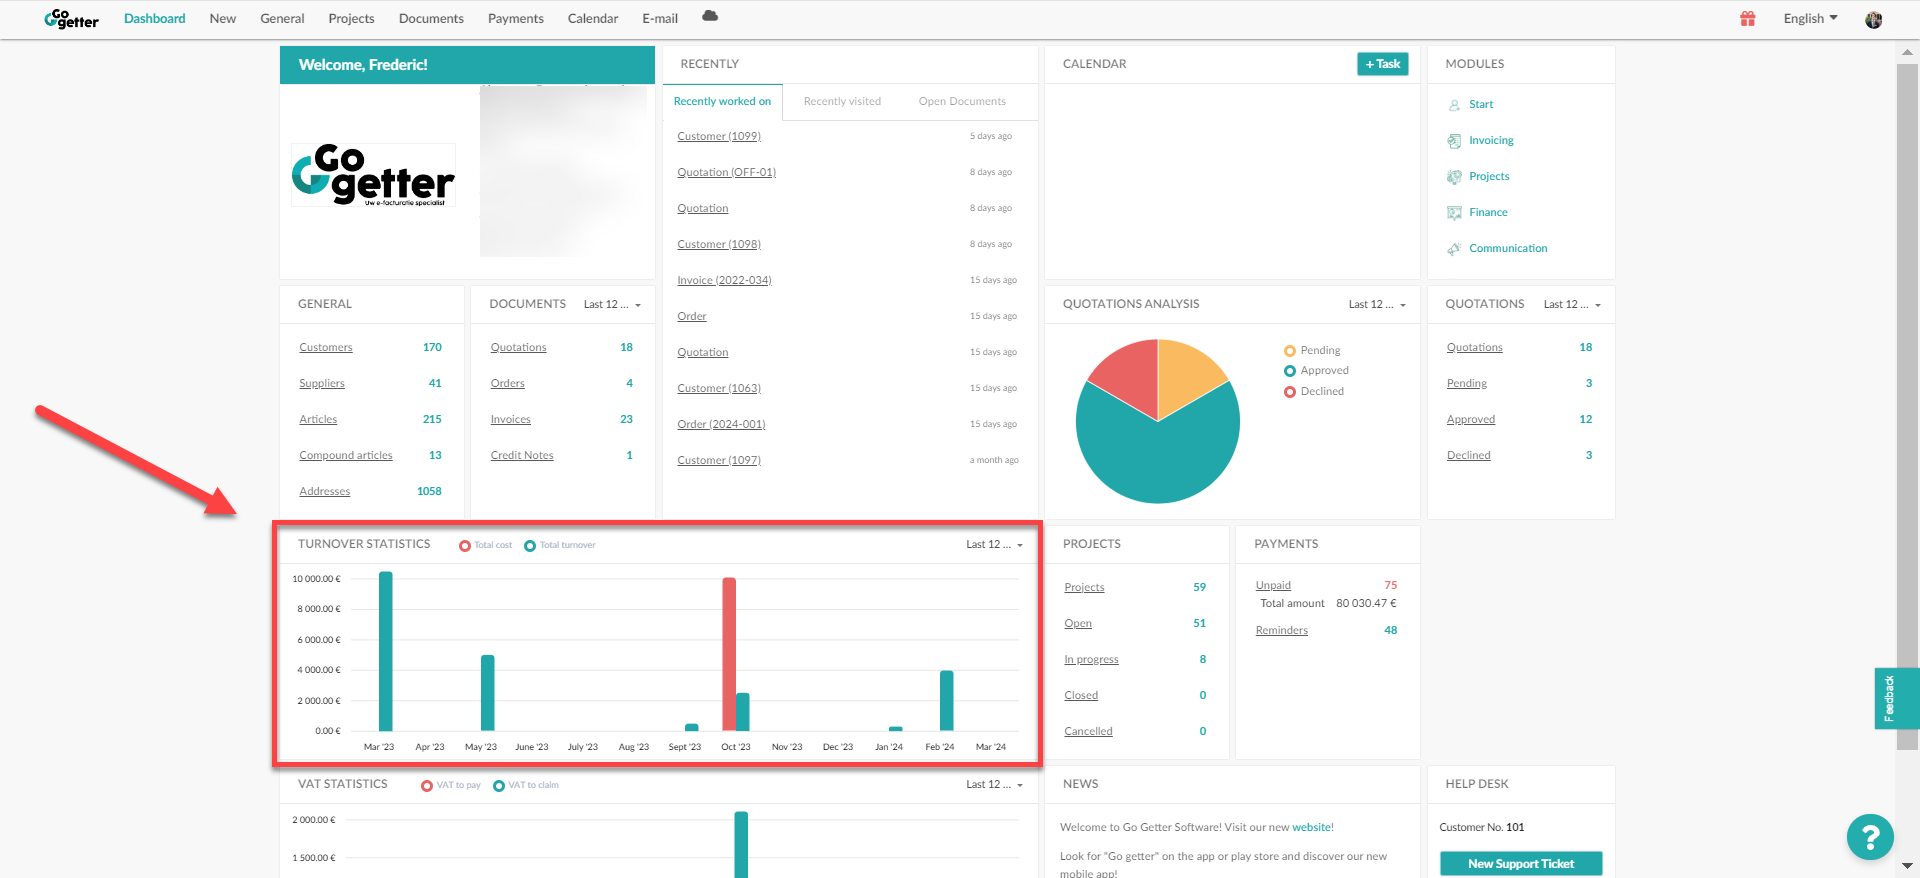
At the top right of the statistics, you can adjust the time horizon. You can opt for the last 12 months or the financial year.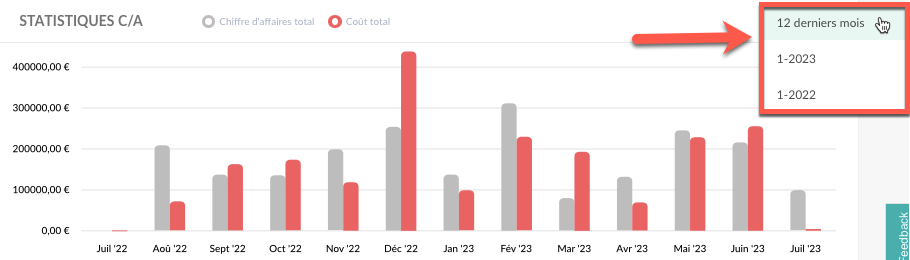
VAT Statistics
This bar chart clearly shows "VAT payable" and "VAT reclaimable".
VAT payable" is based on the VAT invoiced per month (revenue). This is determined by the difference between invoices and credit notes.
VAT reclaim" is based on expenses. It is determined by the difference between invoices and credit notes.
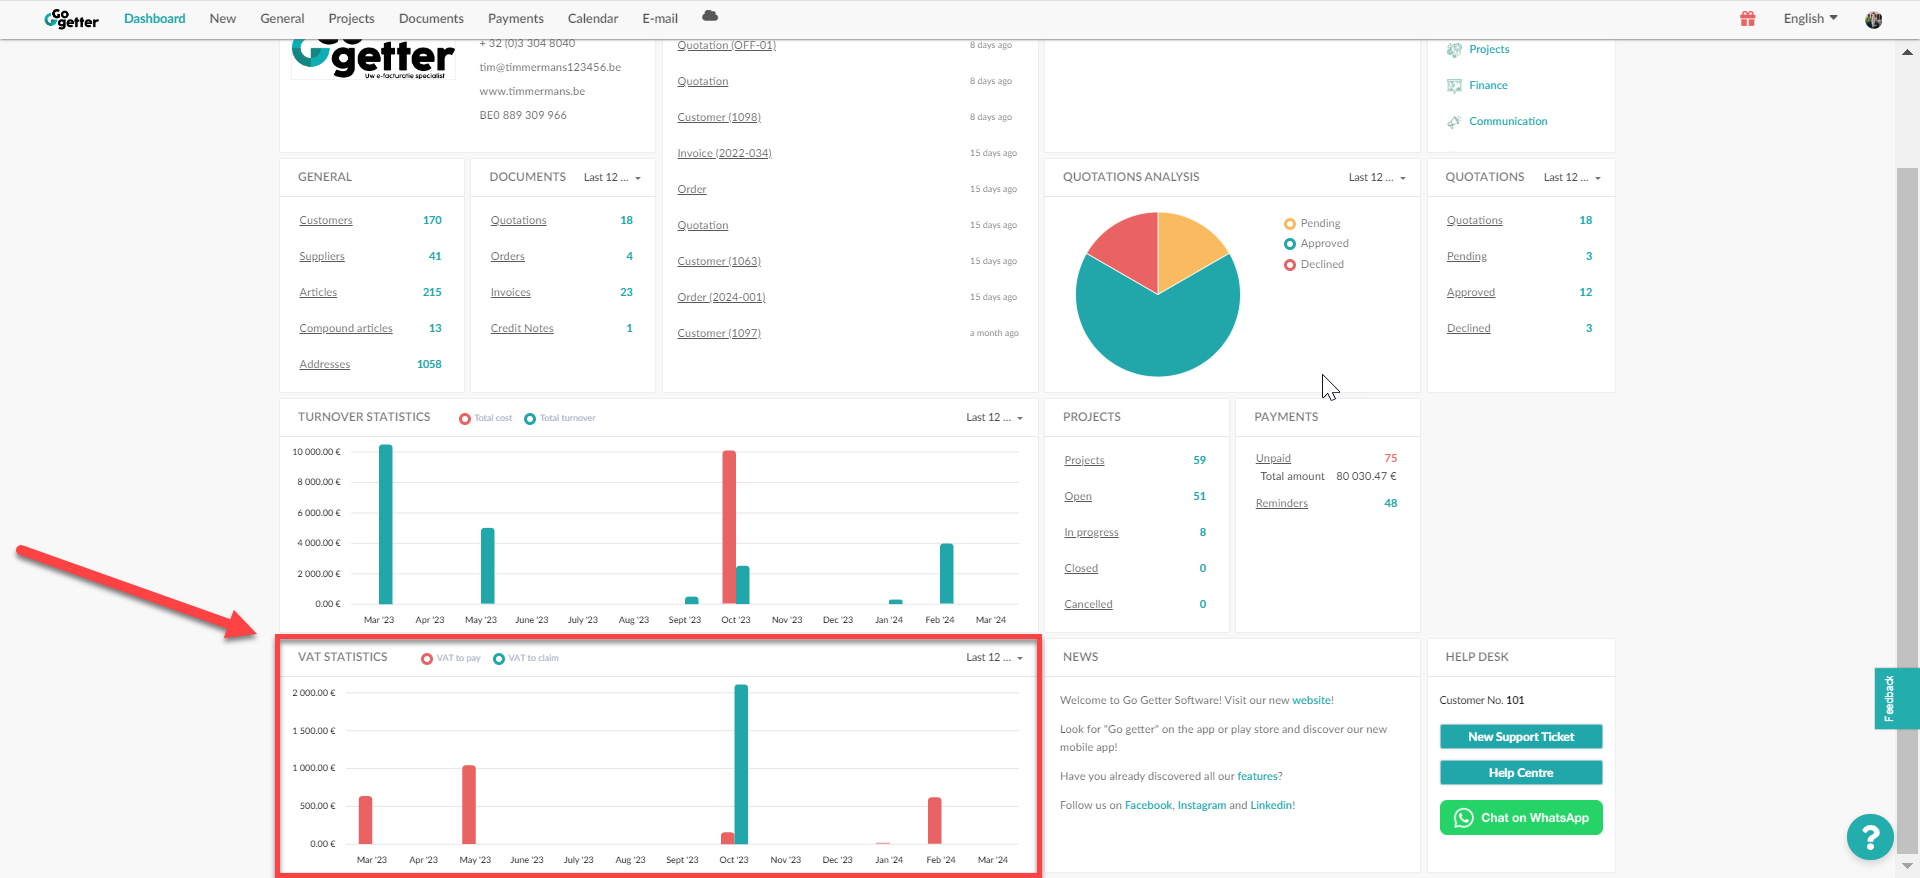
At the top right of the statistics, you can adjust the time horizon. You can opt for the last 12 months or the financial year.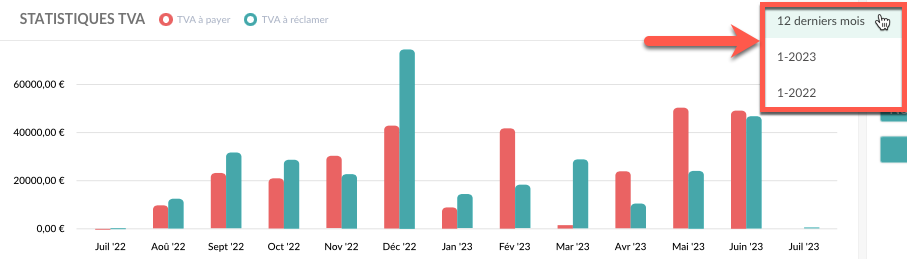
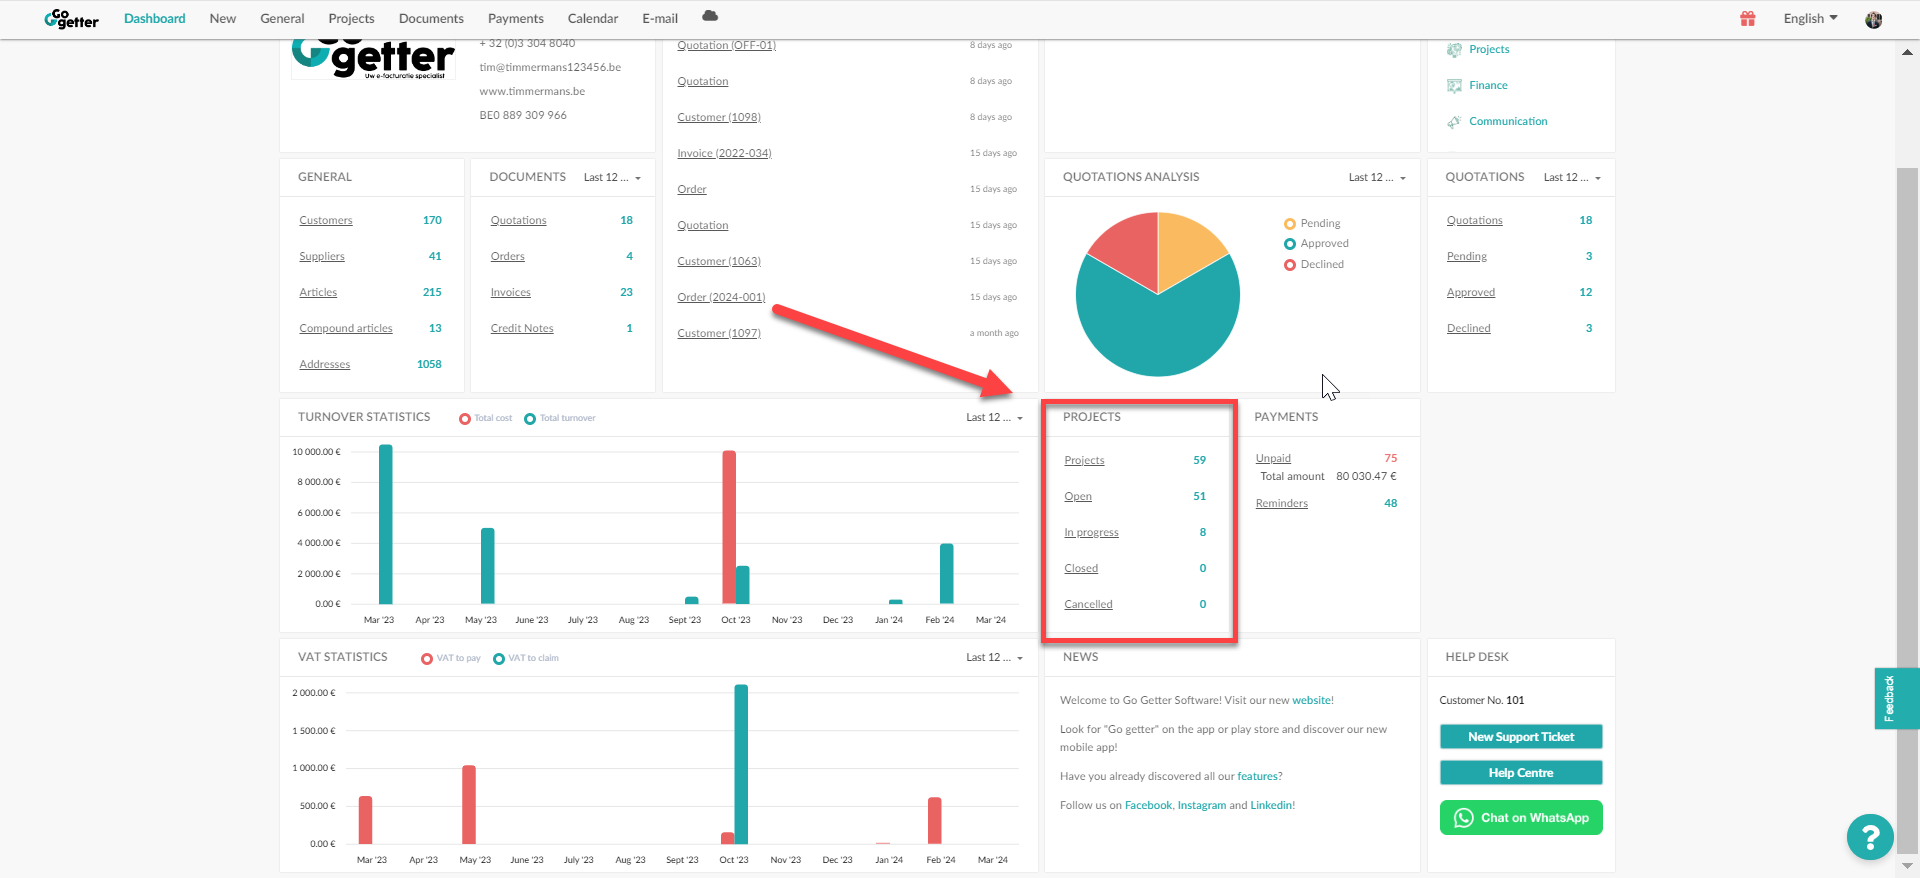
Projets
The status of your projects at a glance.
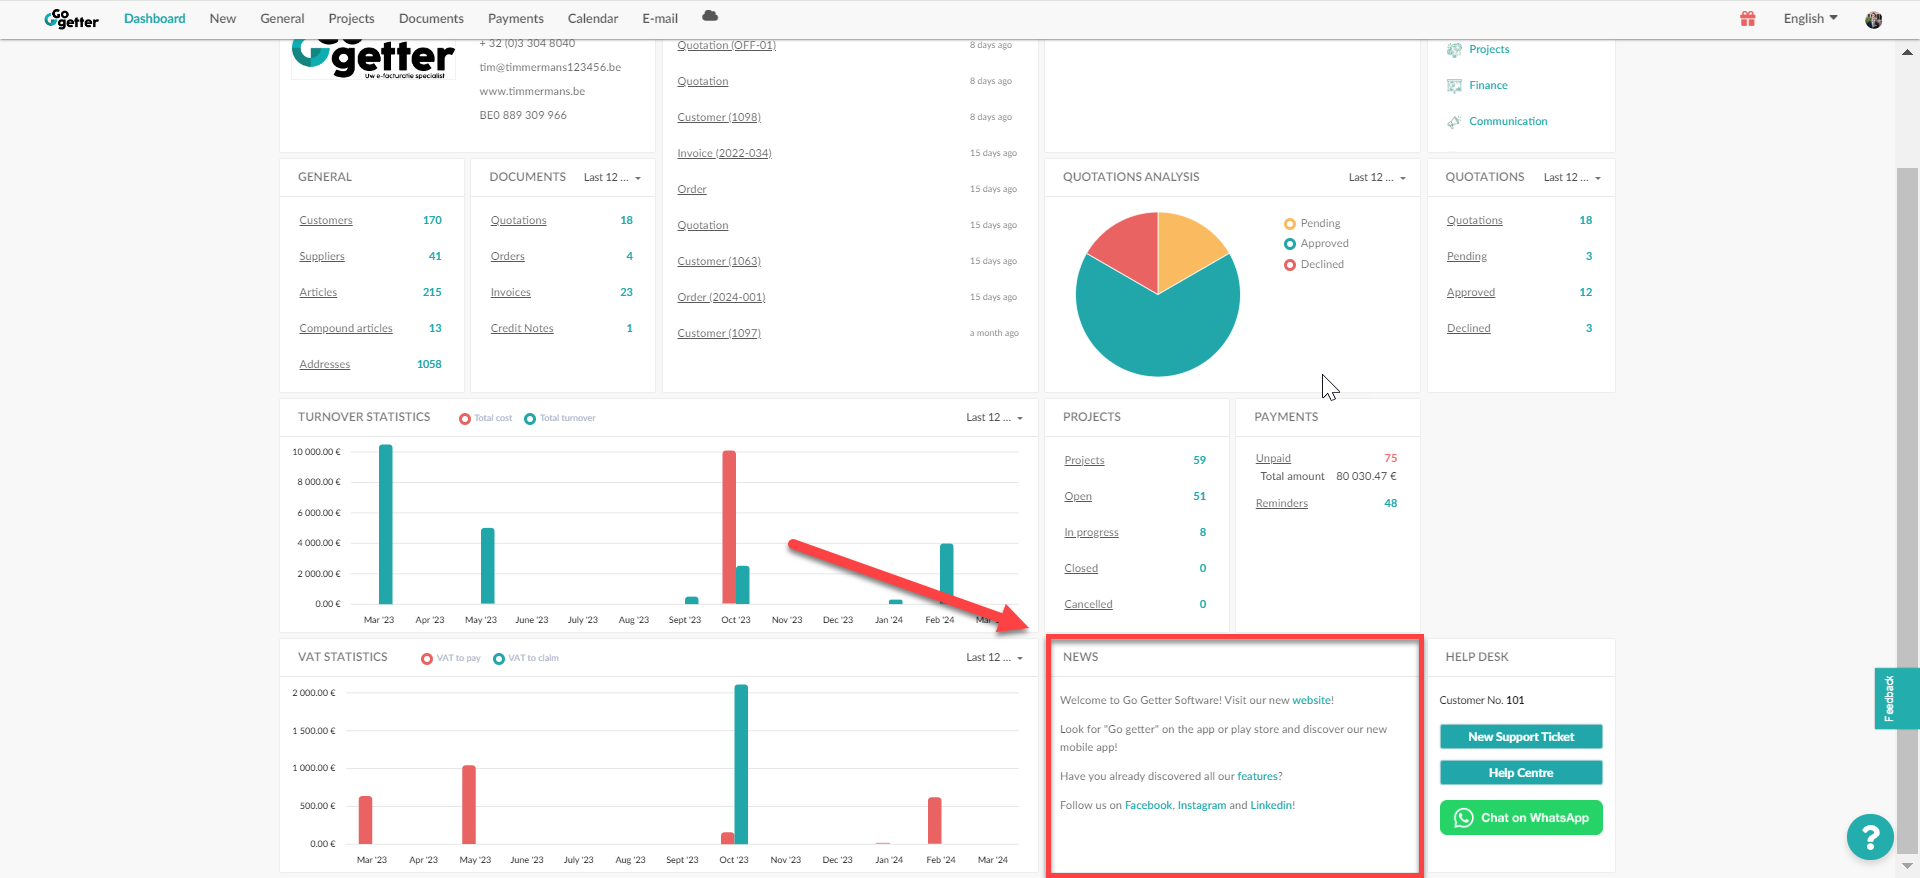
Nouvelles
This section keeps you up to date with new developments. New features and important facts will be posted here.
Helpdesk
Tip: Don't forget to mention your customer number in your communication.
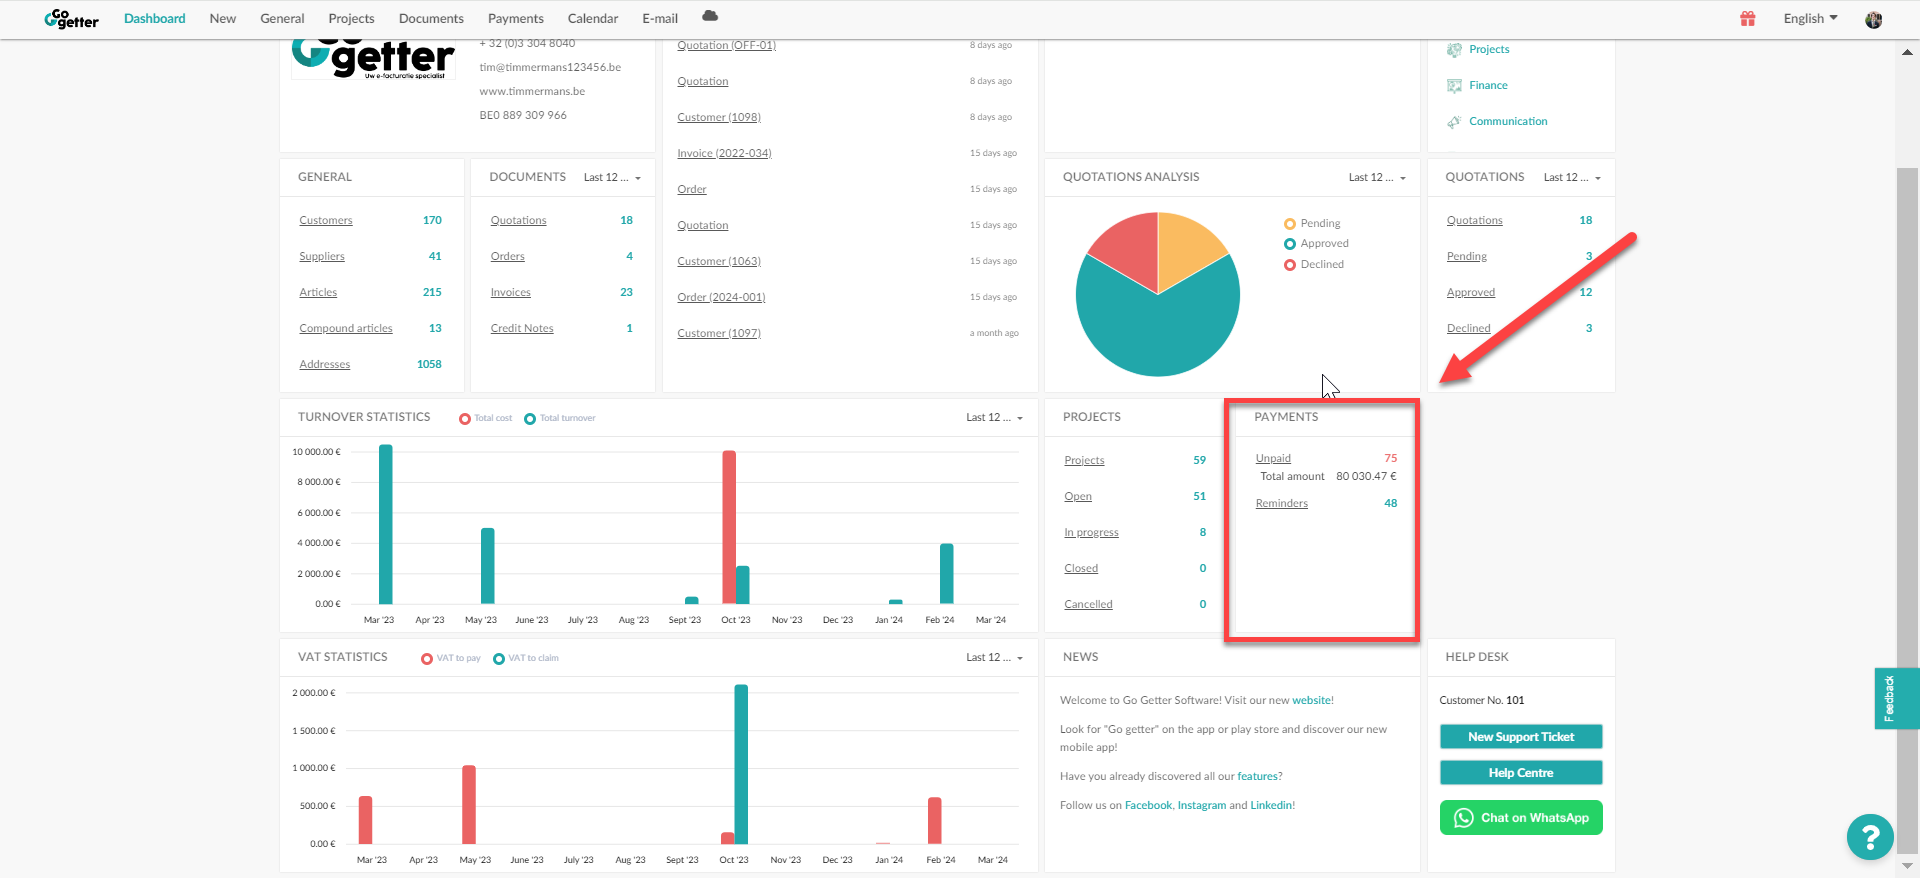
Payments
Payment statistics provide an overview of the number of unpaid invoices and the total amount outstanding. It also shows the number of reminders ready to be sent.
The payments shown in this statistic relate to income!
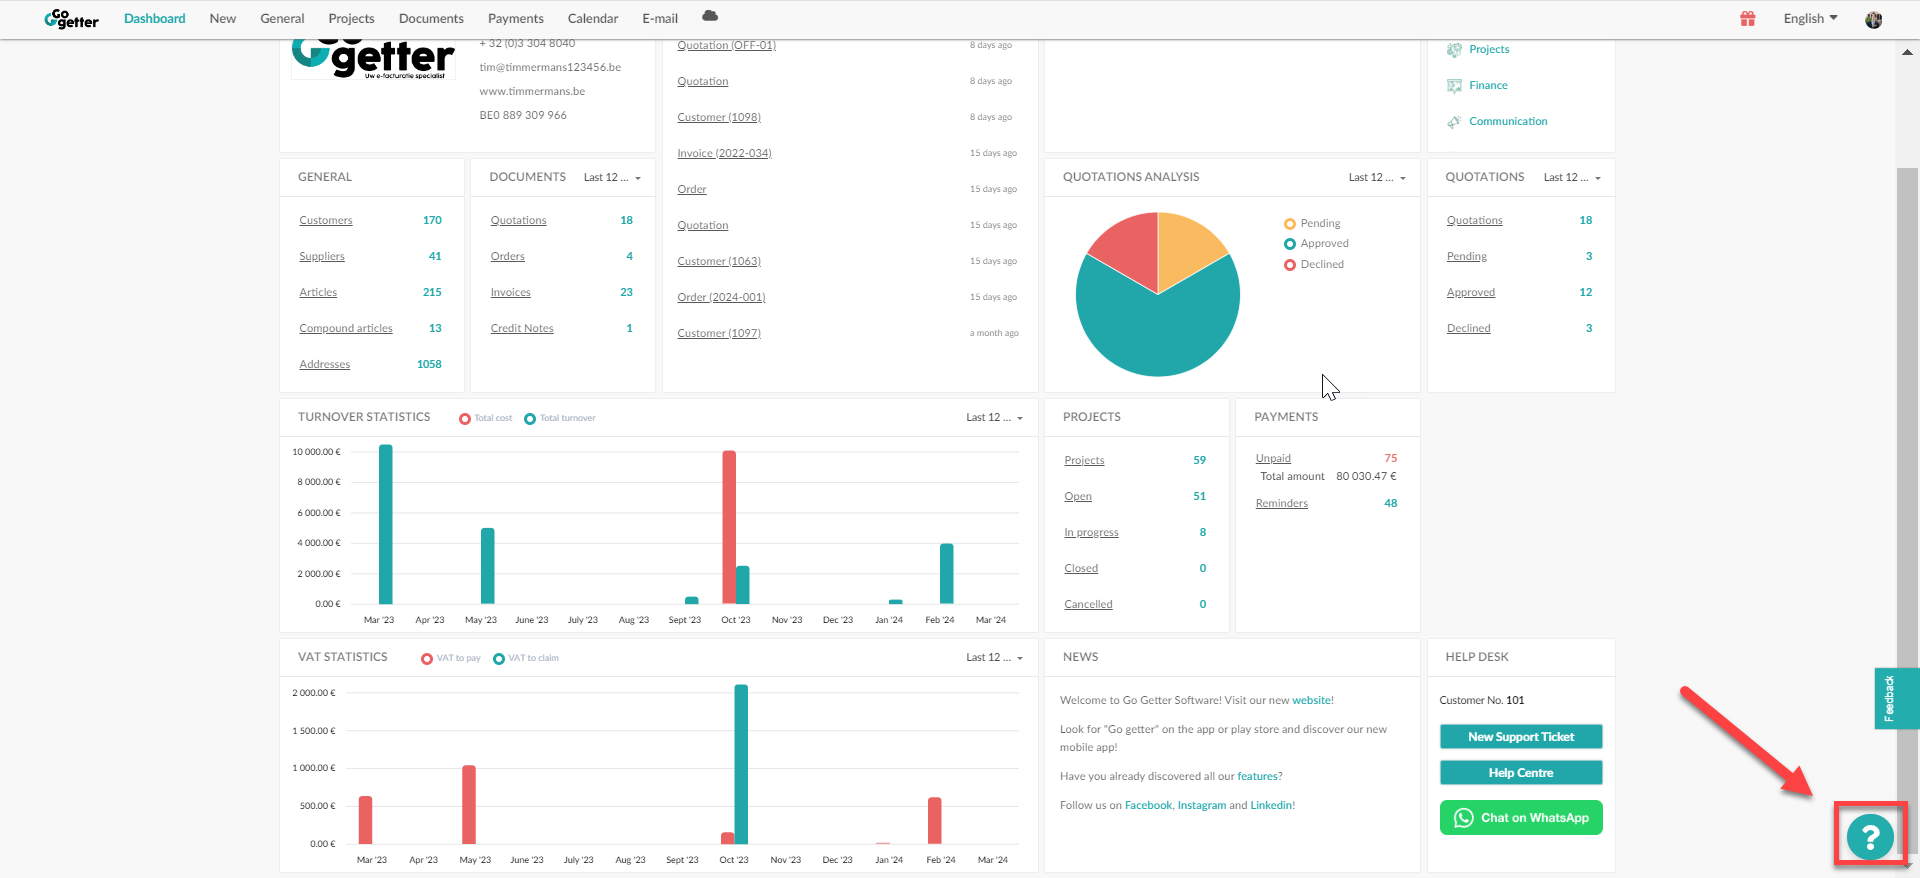
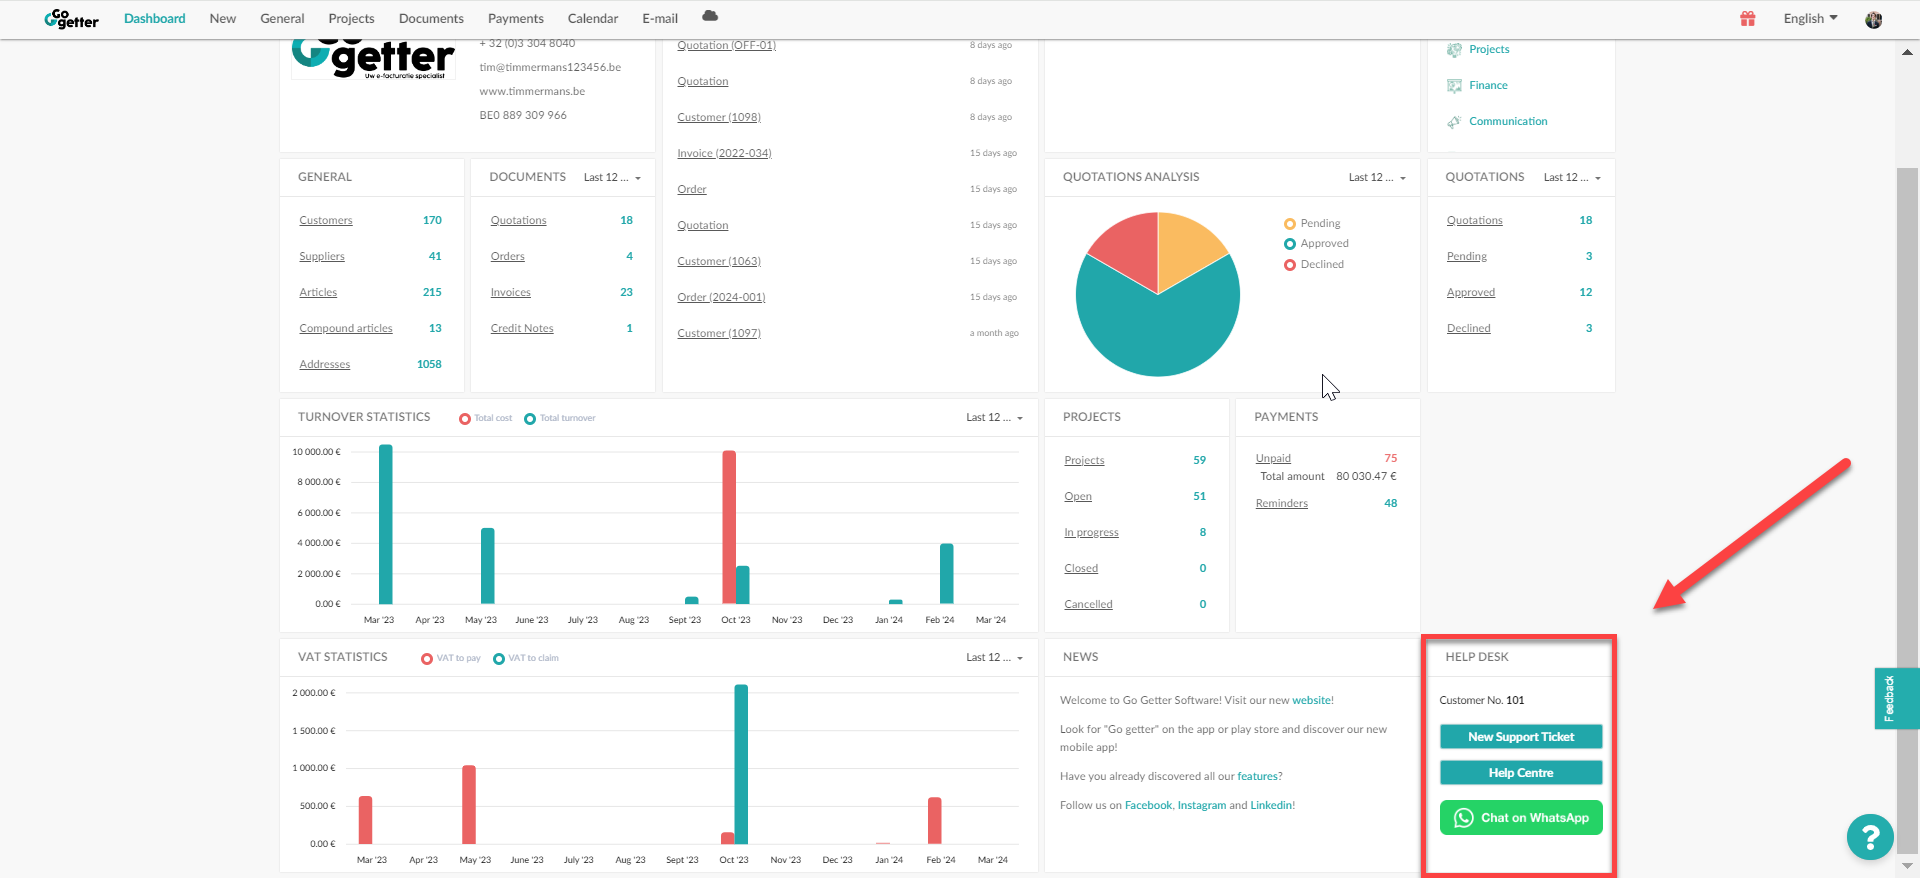
Helpdesk
Thanks to our helpdesk, you can immediately start using your platform, with practical tutorials you can follow. You can also submit a quick question to our happiness controllers via the integrated contact form.